Web analytics provides you with a simple dashboard of common website and app metrics.
This page covers the basic functionality and some common use cases, such as finding when users are most active.
Where do I start?
The best way to get started is to open your web analytics dashboard and take a look at the data, which is all based on how people interact with your app or website.
At a glance, the dashboard has sections for all of the following data:
- Visitors and pageviews: How many people are coming to your website? How many pages do they visit?
- Sessions and session duration: How often do people visit? How long do they stay?
- Paths: What pages are they visiting?
- Channels, referrers, and UTM parameters: Where did they come from?
- Demographic information: What devices, browsers, and operating systems are they using? Where are they located?
- Goals: Are users performing the actions you want them to?
We'll dive into all these below.
How do I use web analytics?
Visitors, pageviews, and sessions
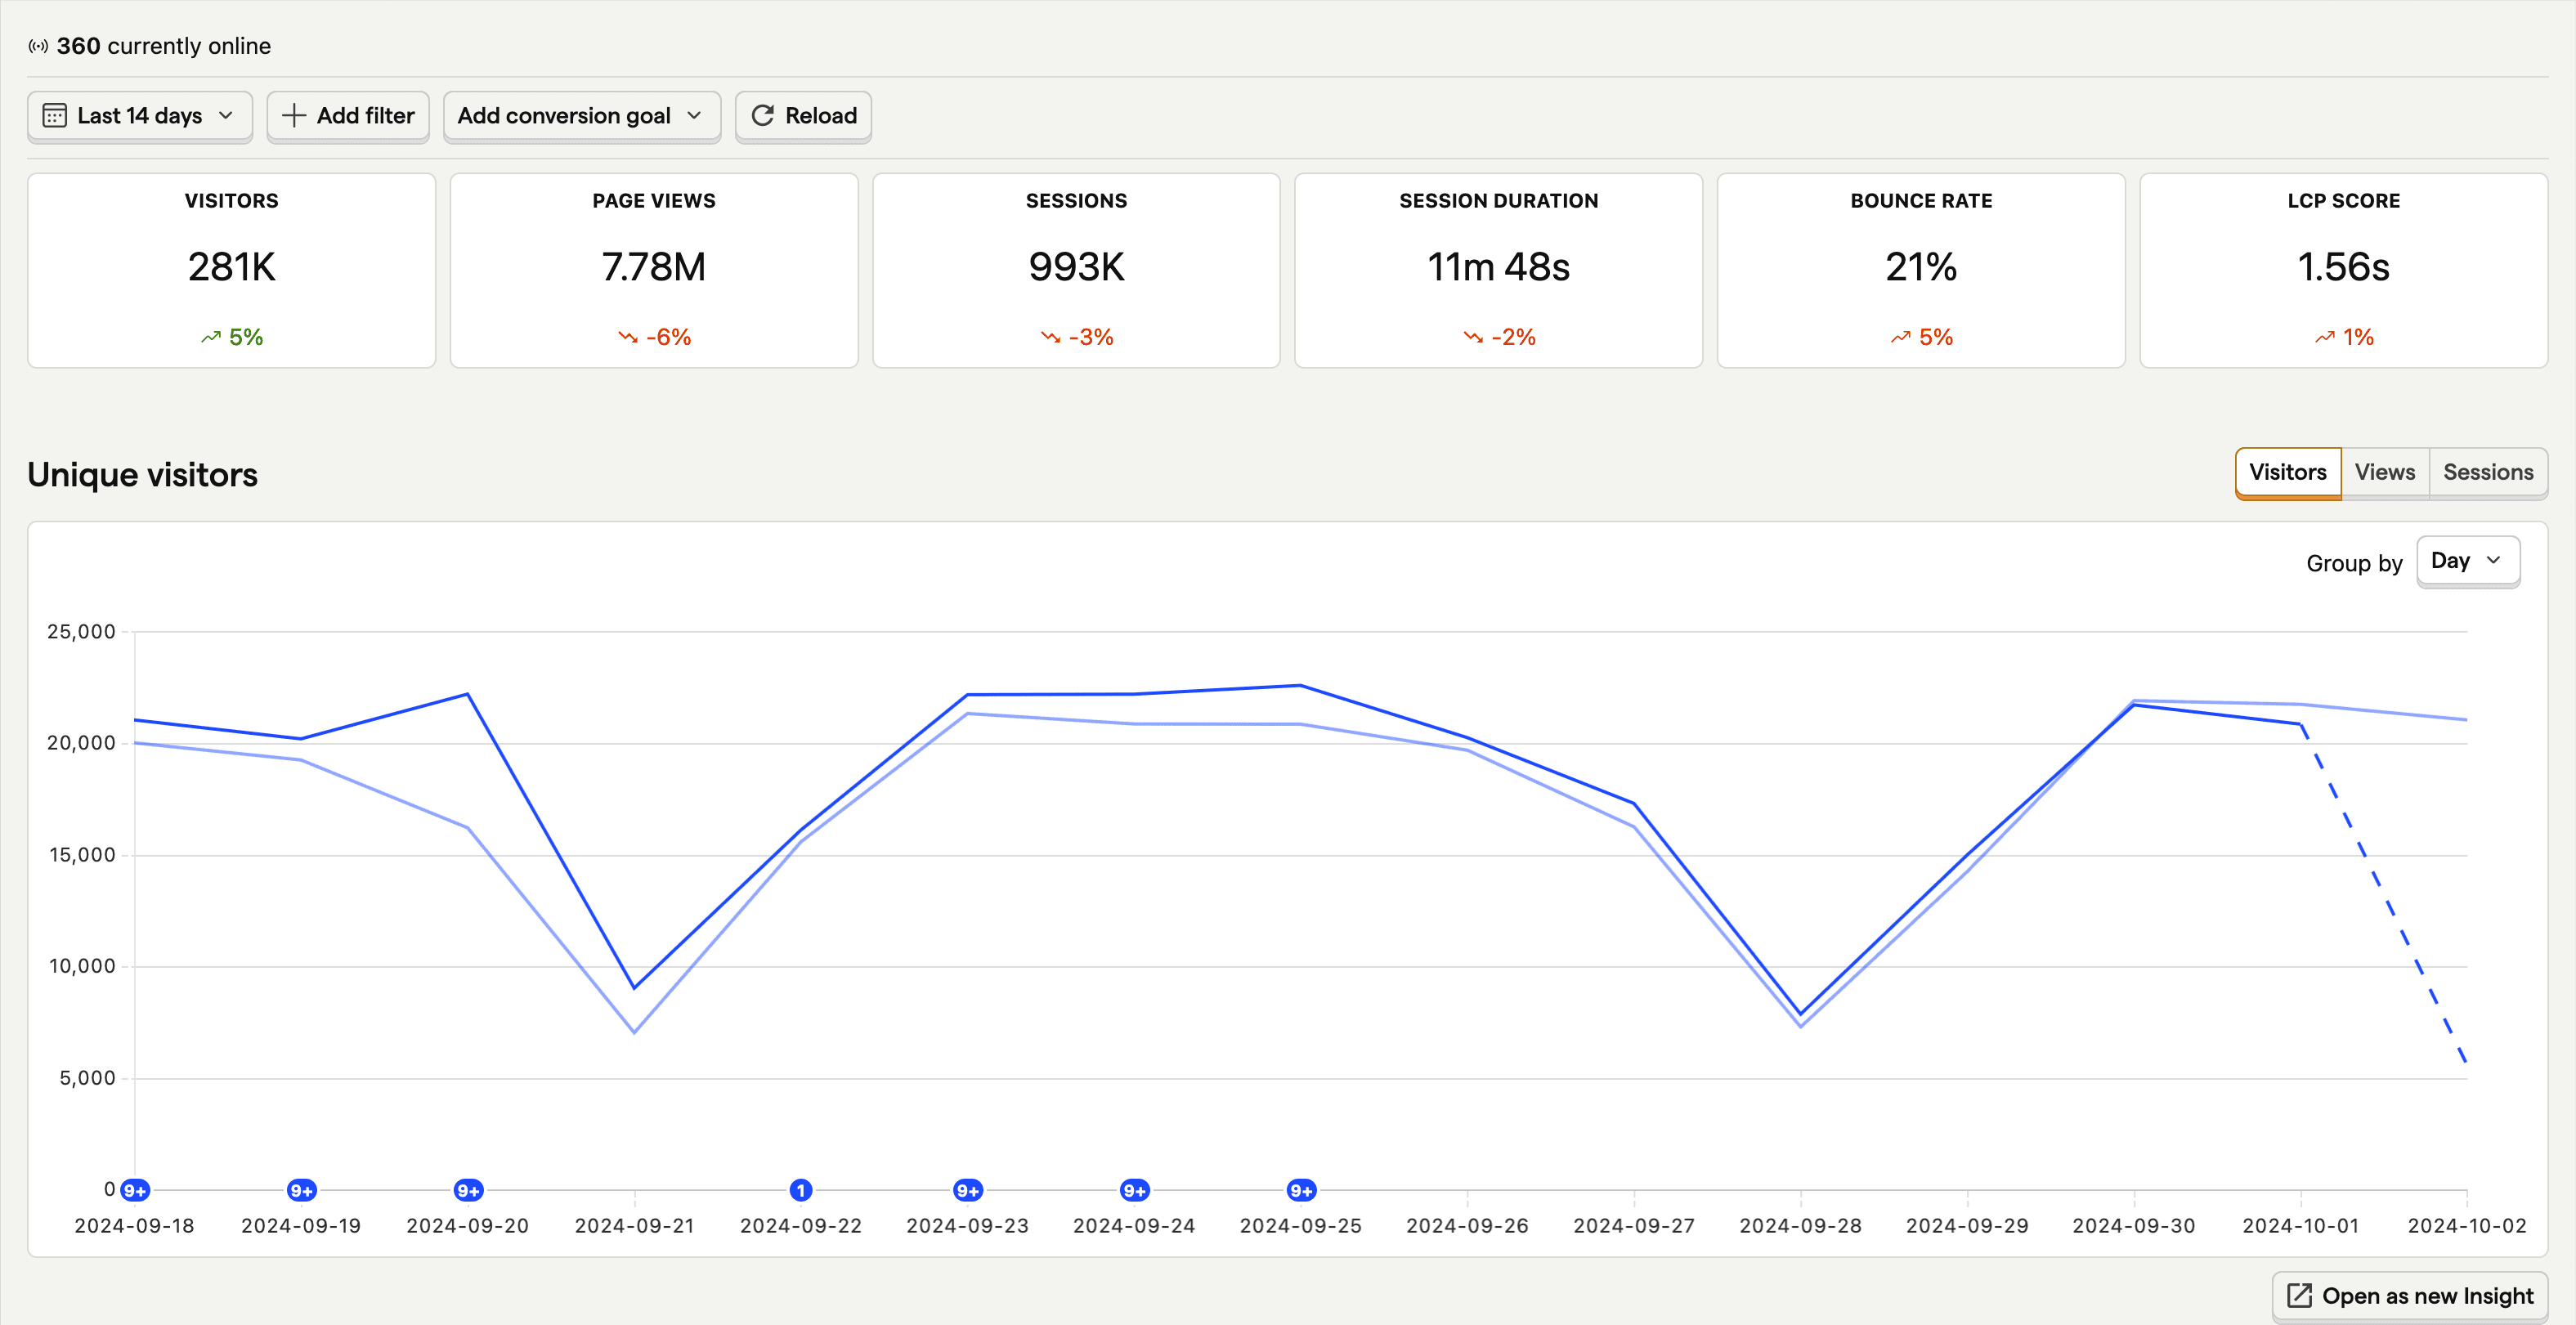
The first thing you'll see at the top of the web analytics dashboard is a graph of visitor data, which we can use to answer questions like:
- How many people are currently online right now?
- How many people visited in the last week, month, or custom time period?
- Is the number of visitors going up or down over a given time period?
What's the difference a between a visitor and a session?
- A session is a set of events for a single visit to your website. Sessions have a beginning, a duration, and an end.
- A visitor represents a single, unique person visiting your site.
In other words, a single visitor will have many sessions as they return to your website. And each session will likely have many pageviews as they move from page to page.
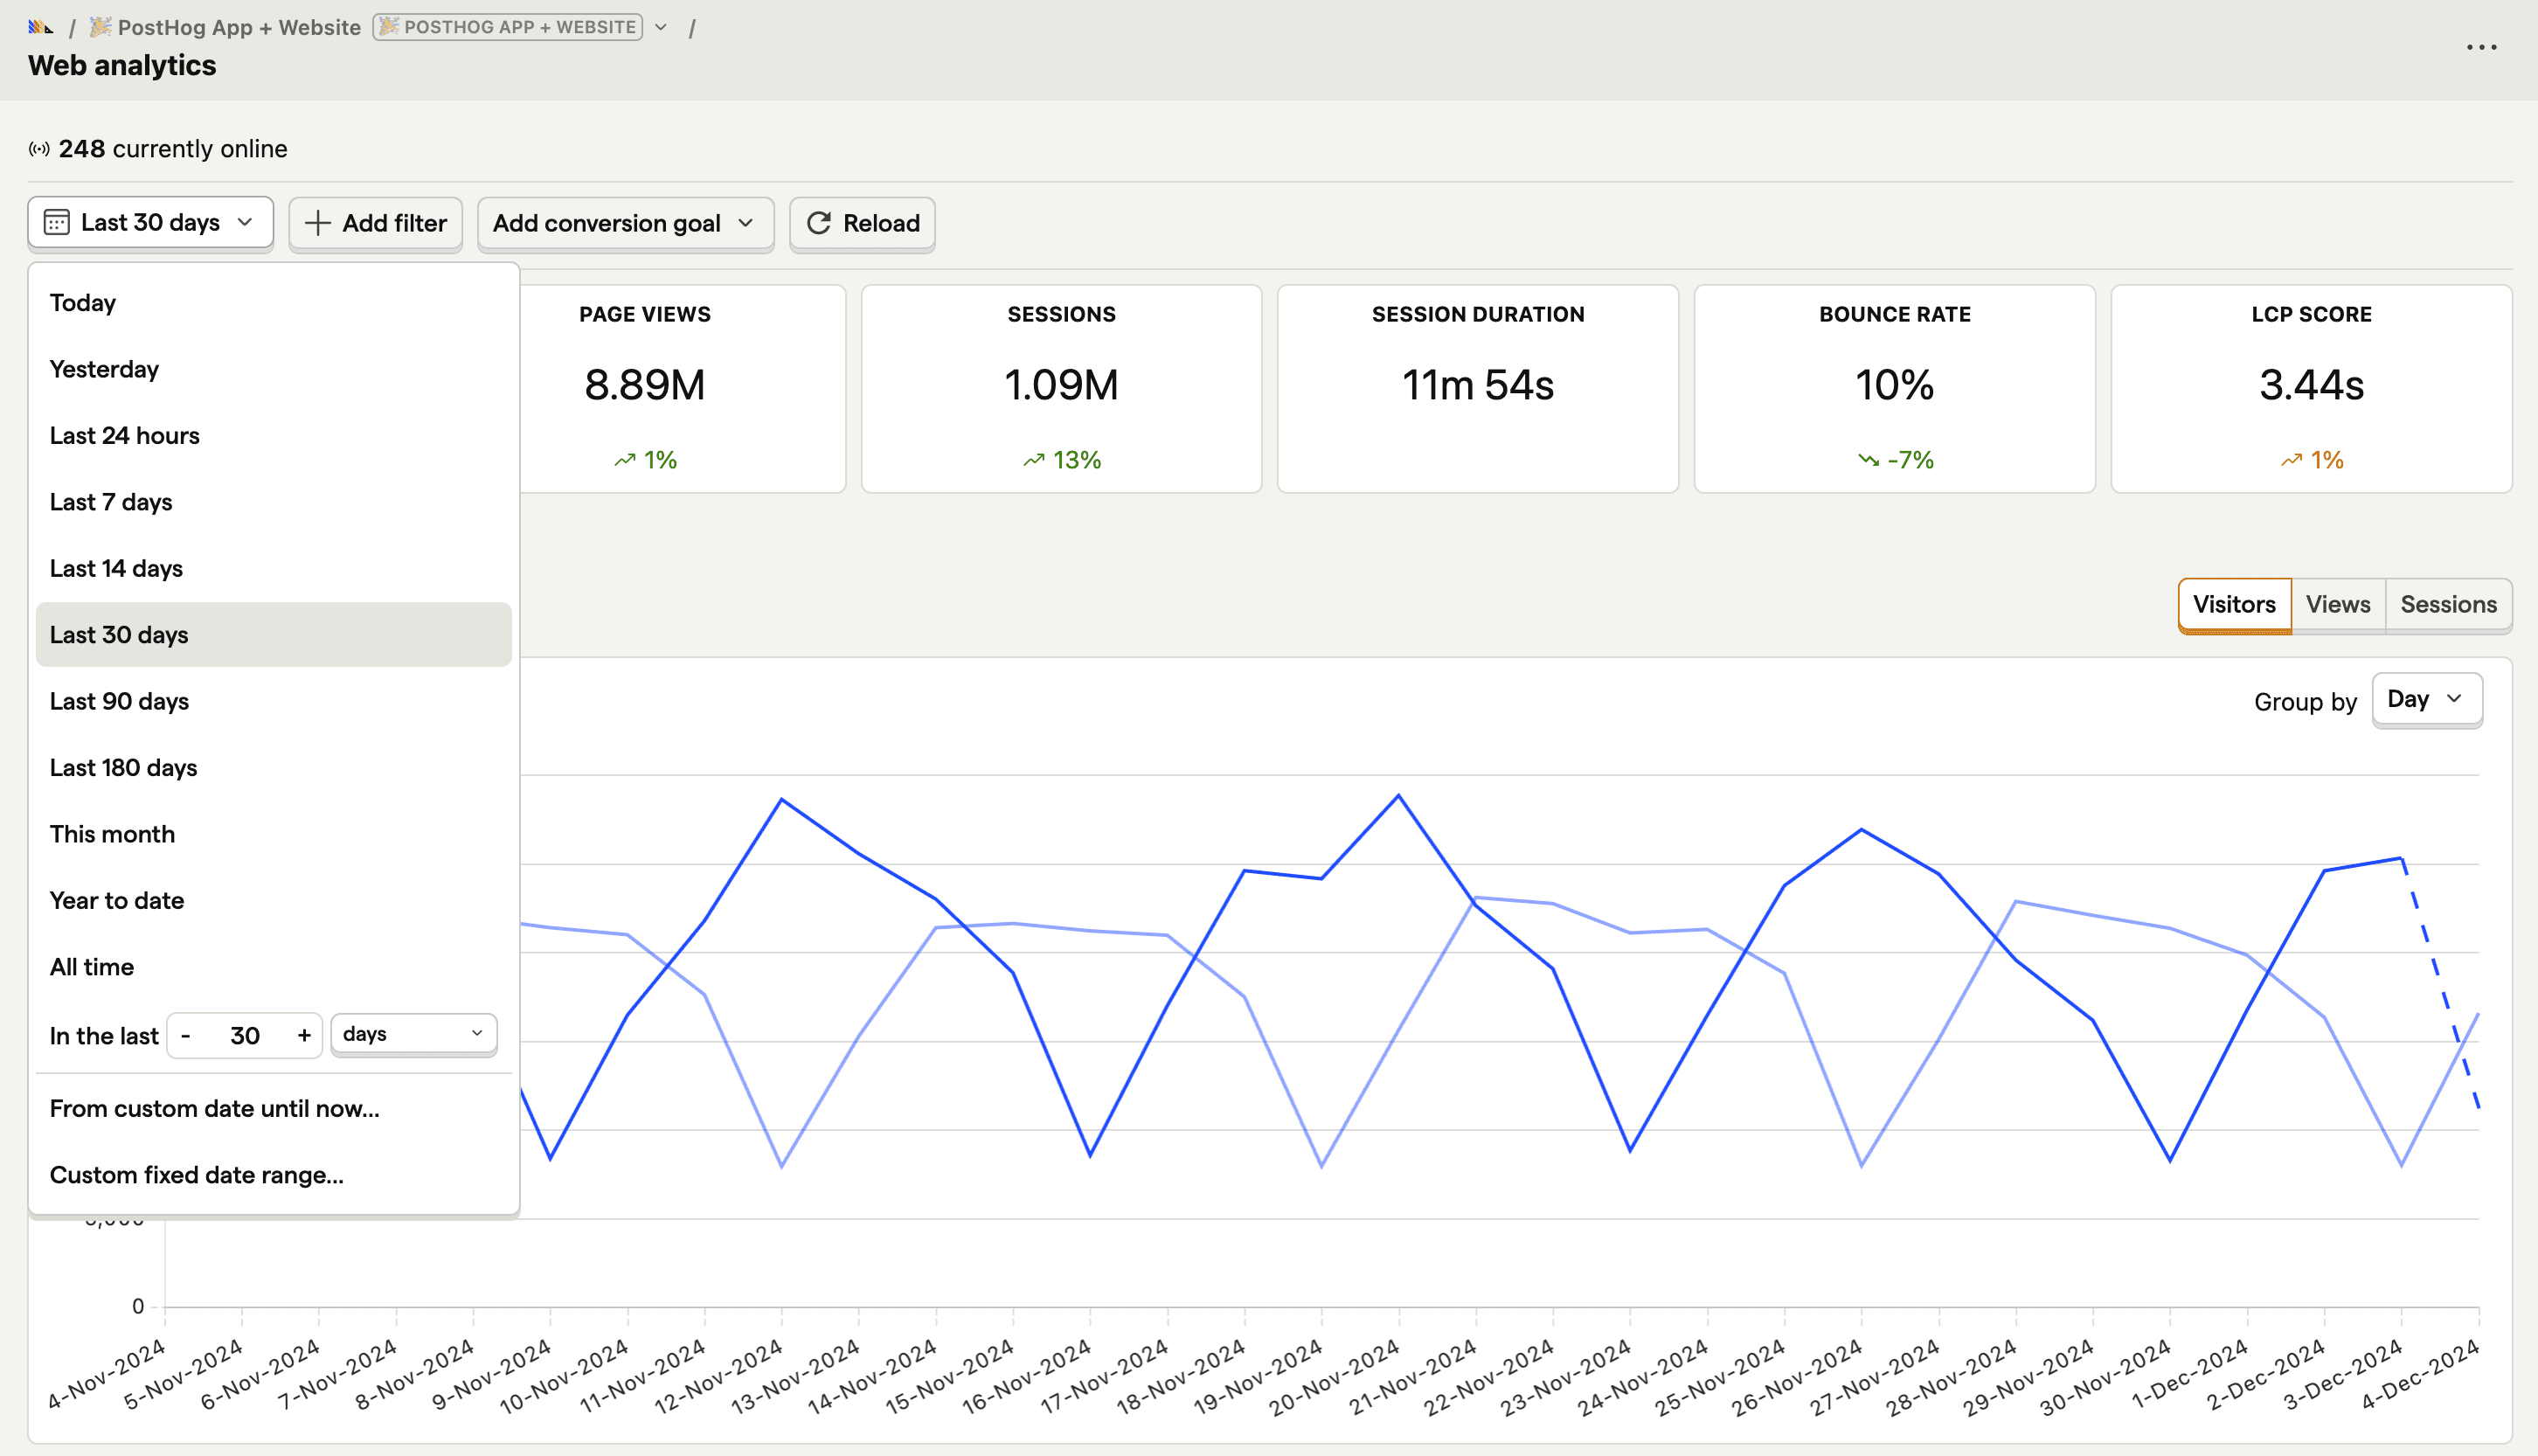
You can adjust the data on your web analytics dashboard to view last 24 hours, the last 7 days, the year-to-date, or any other custom time range.
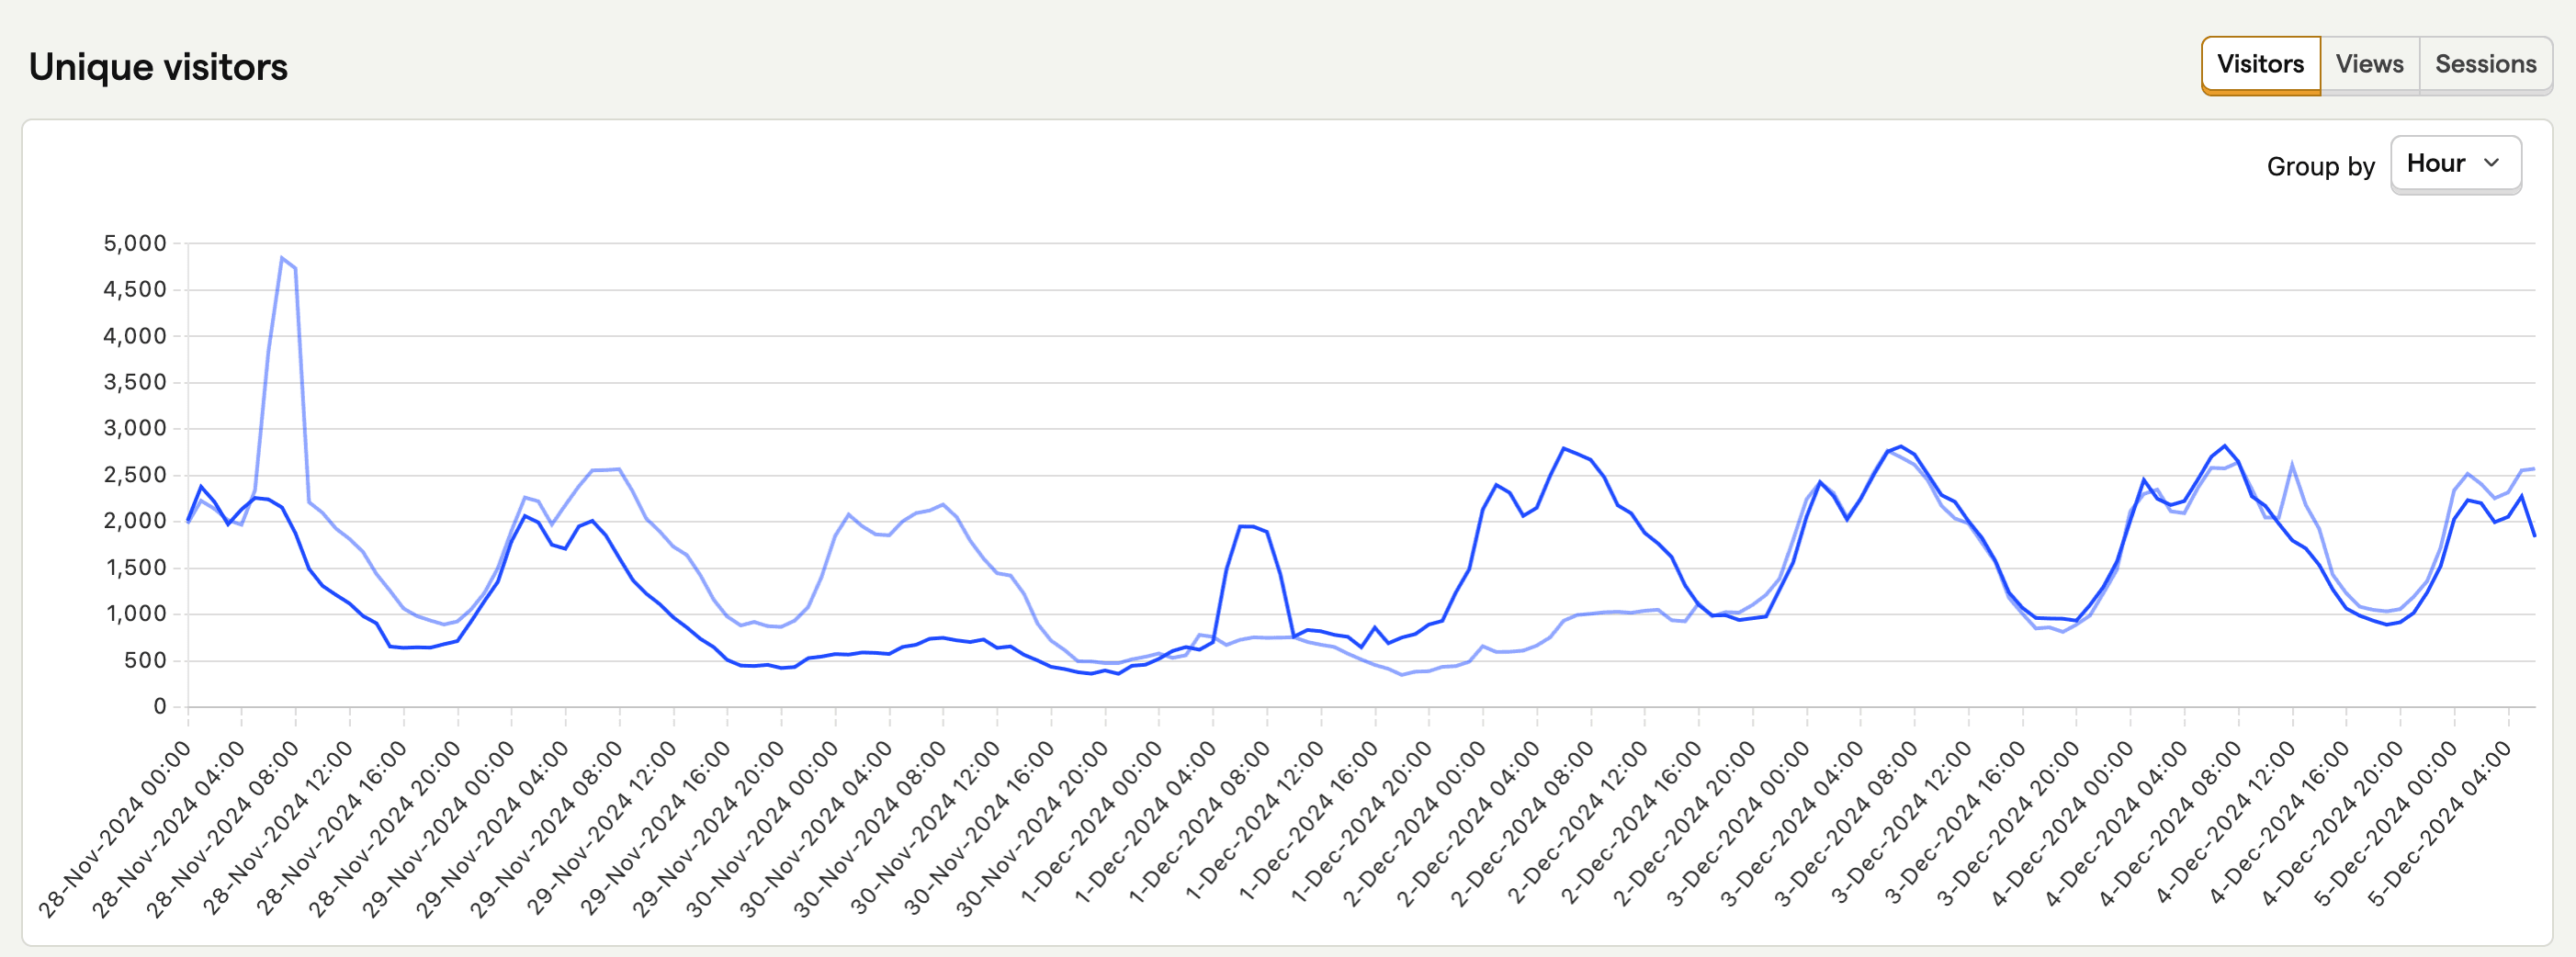
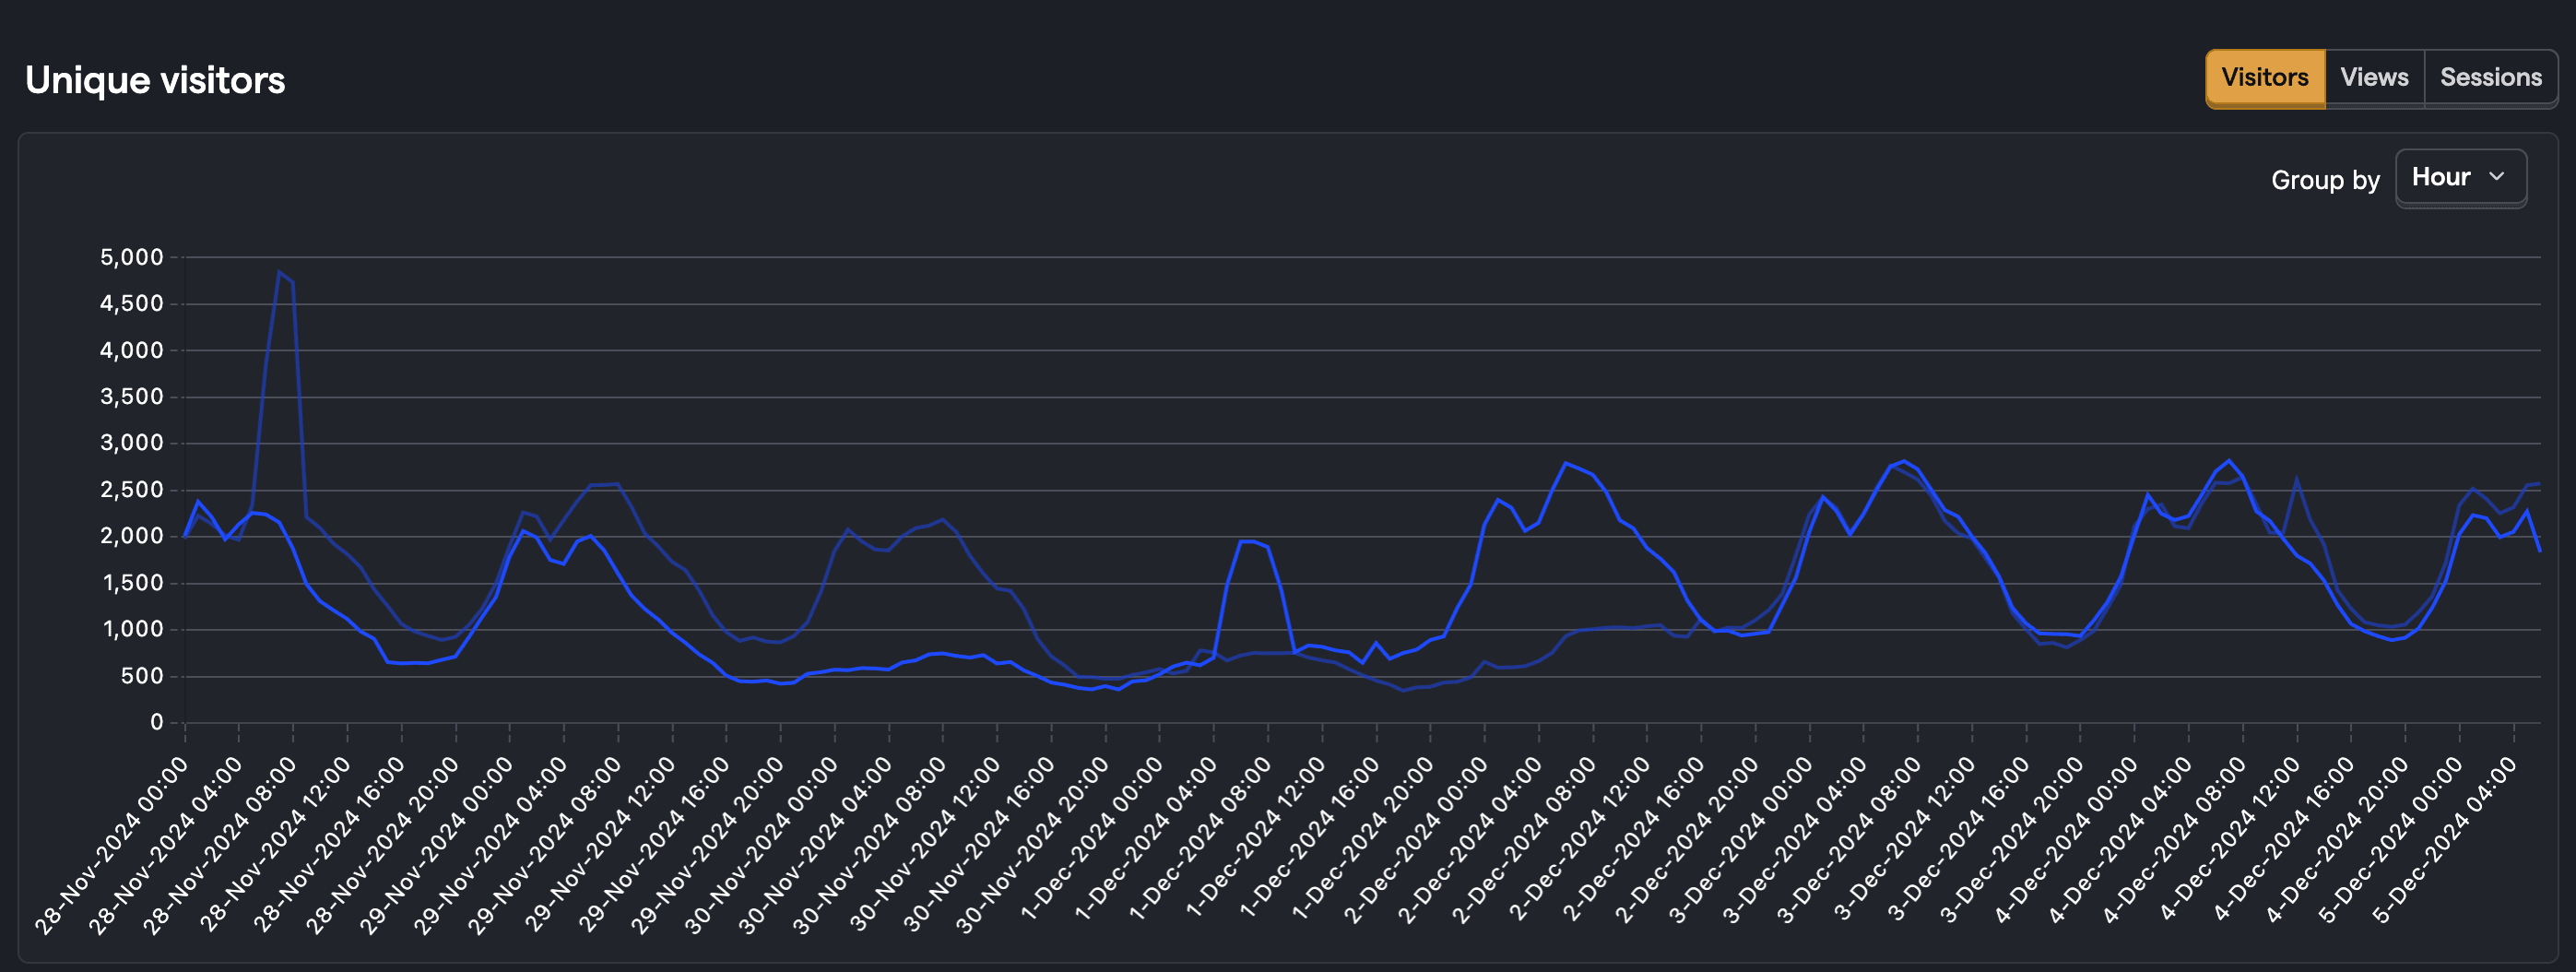
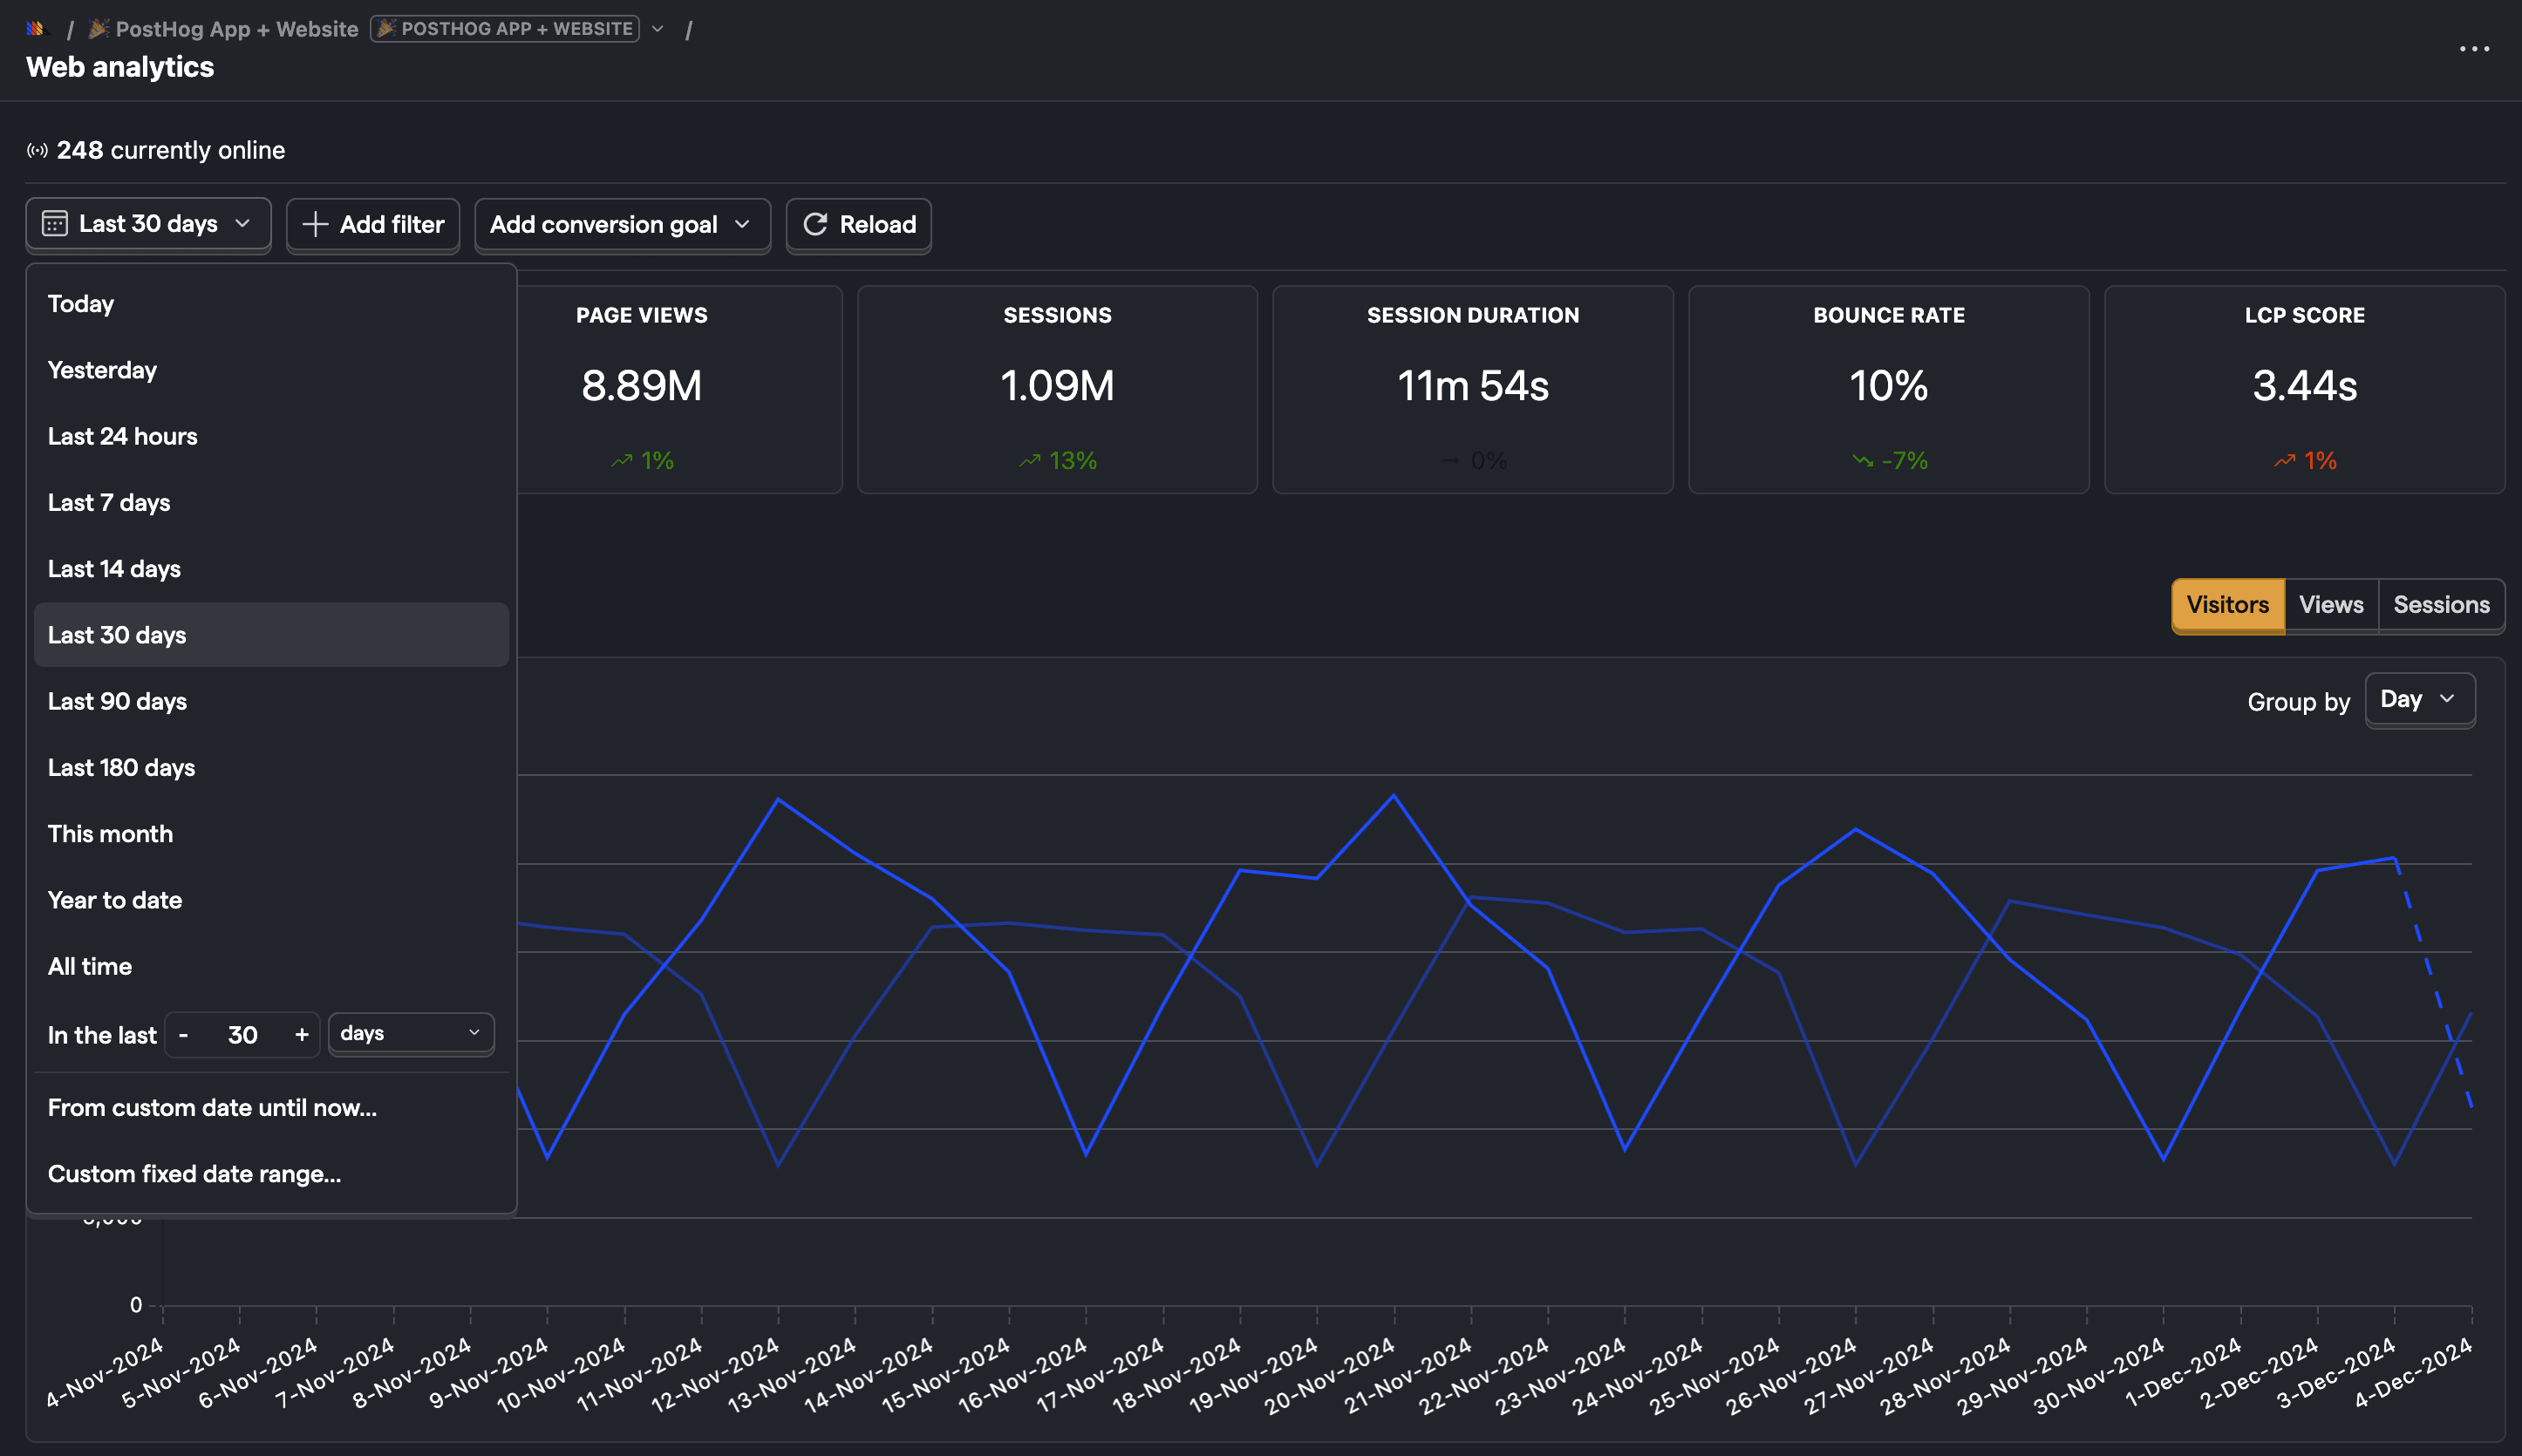
In the screenshot below, we can see the last 30 days of traffic. You can also hover over the graph to see the value for the current period compared with the previous period.
Use case: Finding when users are most active
If you have a weekly newsletter, you may want to send it to your readers at a time they're likely to be active and not miss it. PostHog has a newsletter called Product for Engineers, and we can use these graphs to make an educated guess about when users are most active.
- Filtering by the "Last 30 days" and grouping by day reveals that Tuesdays and Wednesdays are the most active weekdays for our users, whereas Saturdays are the days with the least activity.
- Filtering by the "Last 7 days" and grouping by hour shows the ideal time to send is between 10:00 a.m. and 4:00 p.m. EST.
Paths
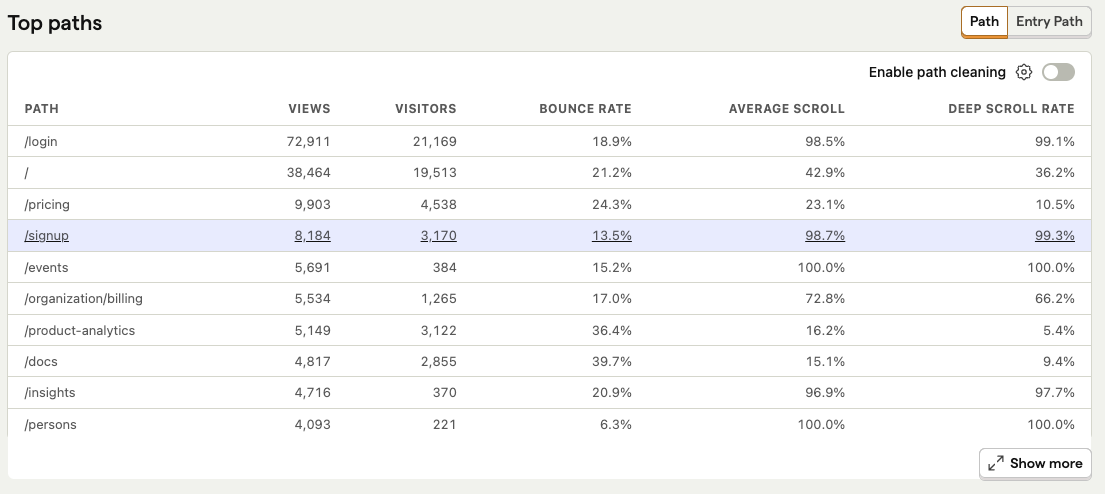
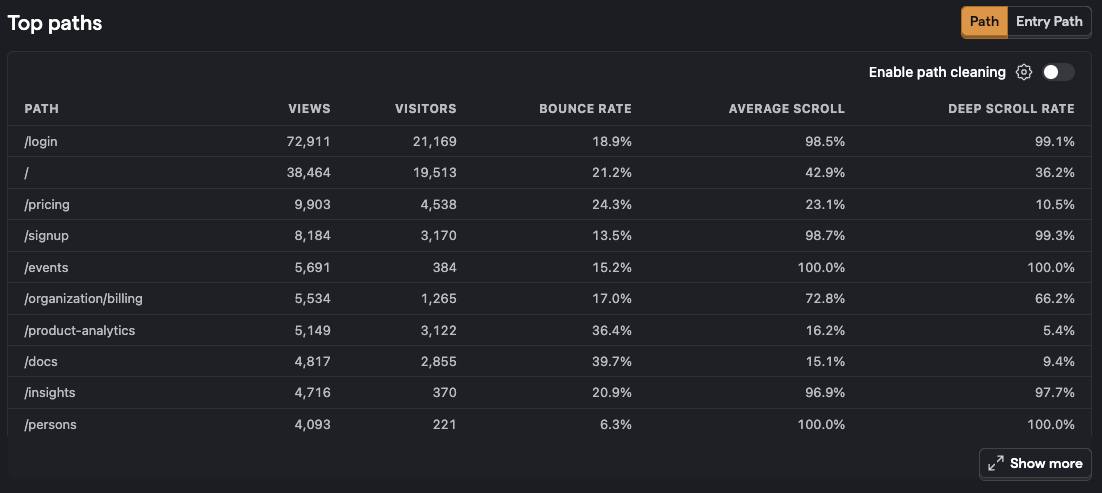
Paths show you all the specific pages accessed in your app or website, which can help answer questions like the following:
- What content is popular and effective?
- What is the last page people visit before leaving?
- What is the bounce rate for a particular page?
Bounce rate is the percentage of users who leave your page immediately after visiting. In other words, a bounce is when someone lands on a page, but doesn't interact with it and leaves within 10 seconds. For more information, we also have a tutorial available for how to calculate bounce rate.
You can drill down into specific pages and event properties using the + Add filter button.
You'll have dozens or even hundreds of data points to use for filtering, but here are a handful of examples:
- filter where Path Name is equal to
"/pricing" - filter where Device Type is equal to
"Desktop" - filter where Referrer URL contains
"youtube.com"
The paths section of the dashboard also makes it easy to filter for specific pages. Instead of using the filter button, you can click on any of the paths in the list to filter the dashboard for that specific path.
This section also has tabs for finding the entry paths, end paths, and outbound clicks:
- Entry path shows stats for the first page a user saw when they opened your website
- End path shows stats for the last page a user visited before their session ended
- Outbound clicks show which links that users clicked on to leave your site
Use case: Finding the most popular content
PostHog hosts developer documentation at
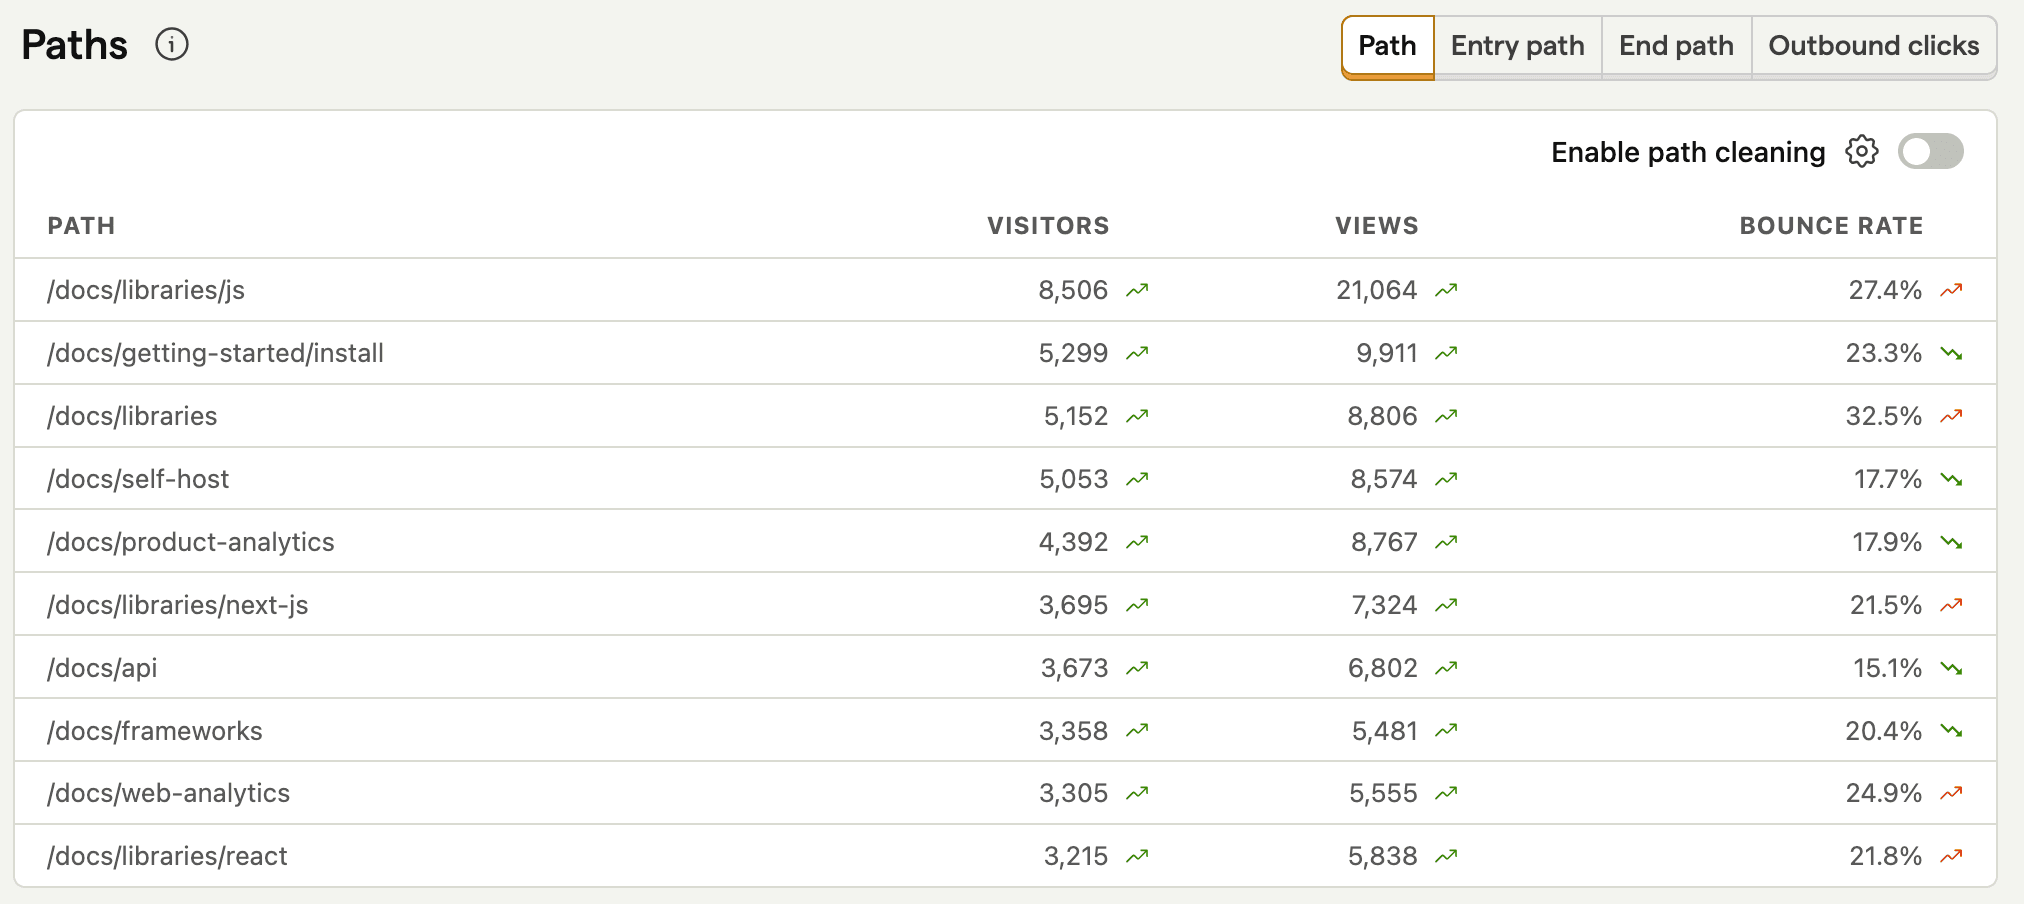
/docs. What if we want to find the most popular docs? We can click the + Add filter button and add a filter where Path Name contains"/docs/". And then we can see the results with the most popular documentation:
Channels, referrers, and UTM sources
The web analytics dashboard also enables you to find out where traffic is coming from.
Channels
Channels distinguish between different sources that are bringing traffic to your website. They're also sometimes called marketing channels or acquisition channels. Here are some examples:
- Search: visitors from a search engine like Google (you can also distinguish between traffic from organic search results and paid ads)
- Social: visitors from social media site
- Referrals: visitors that clicked a referral link (more on this below)
- Direct: visitors that went directly to your website (by typing the URL or clicking a bookmark for example)
This is just a small sample of the available channels to give you an idea of how to get started. There's a full list of available channel types, and you can define your own custom channels as well.
Referrers
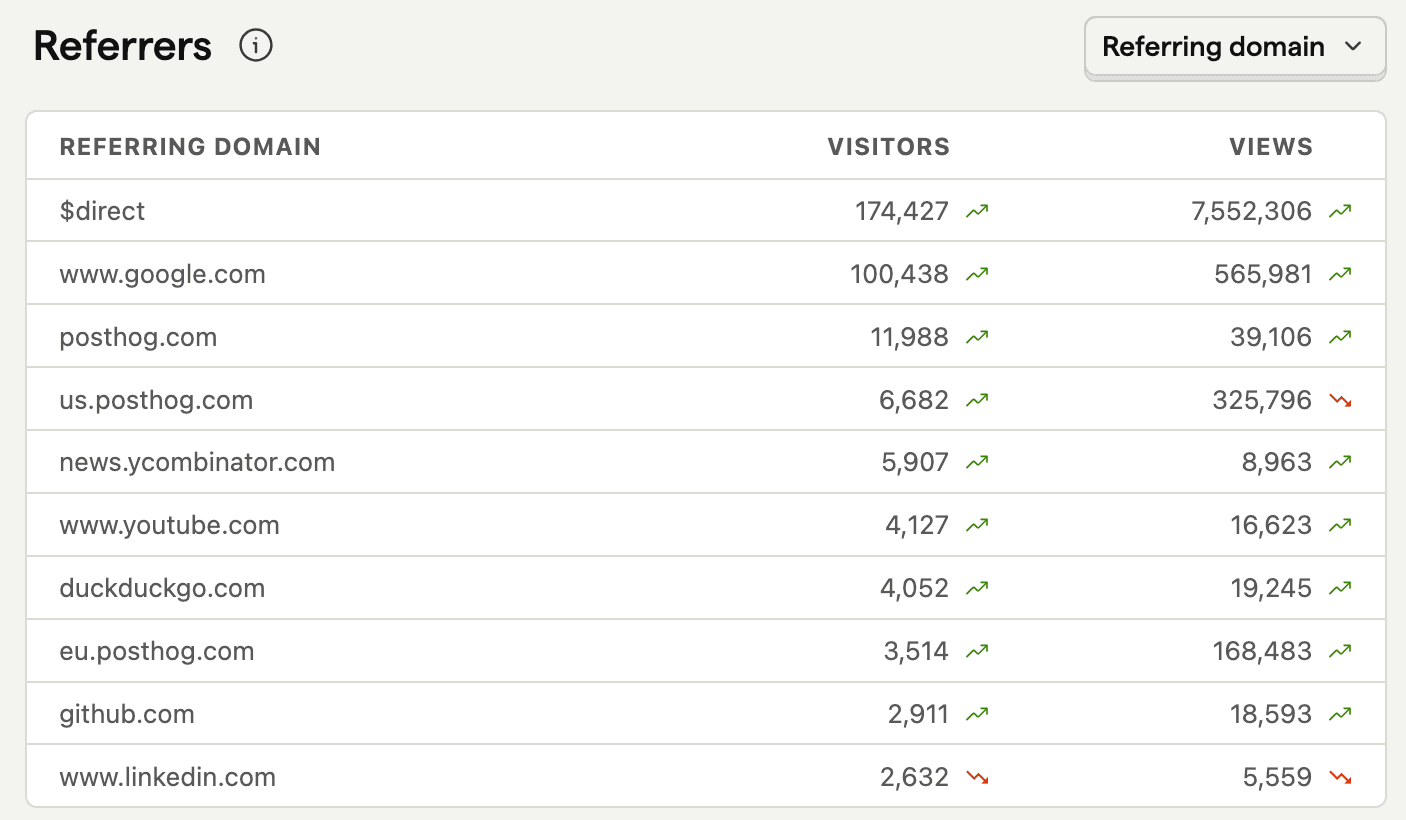
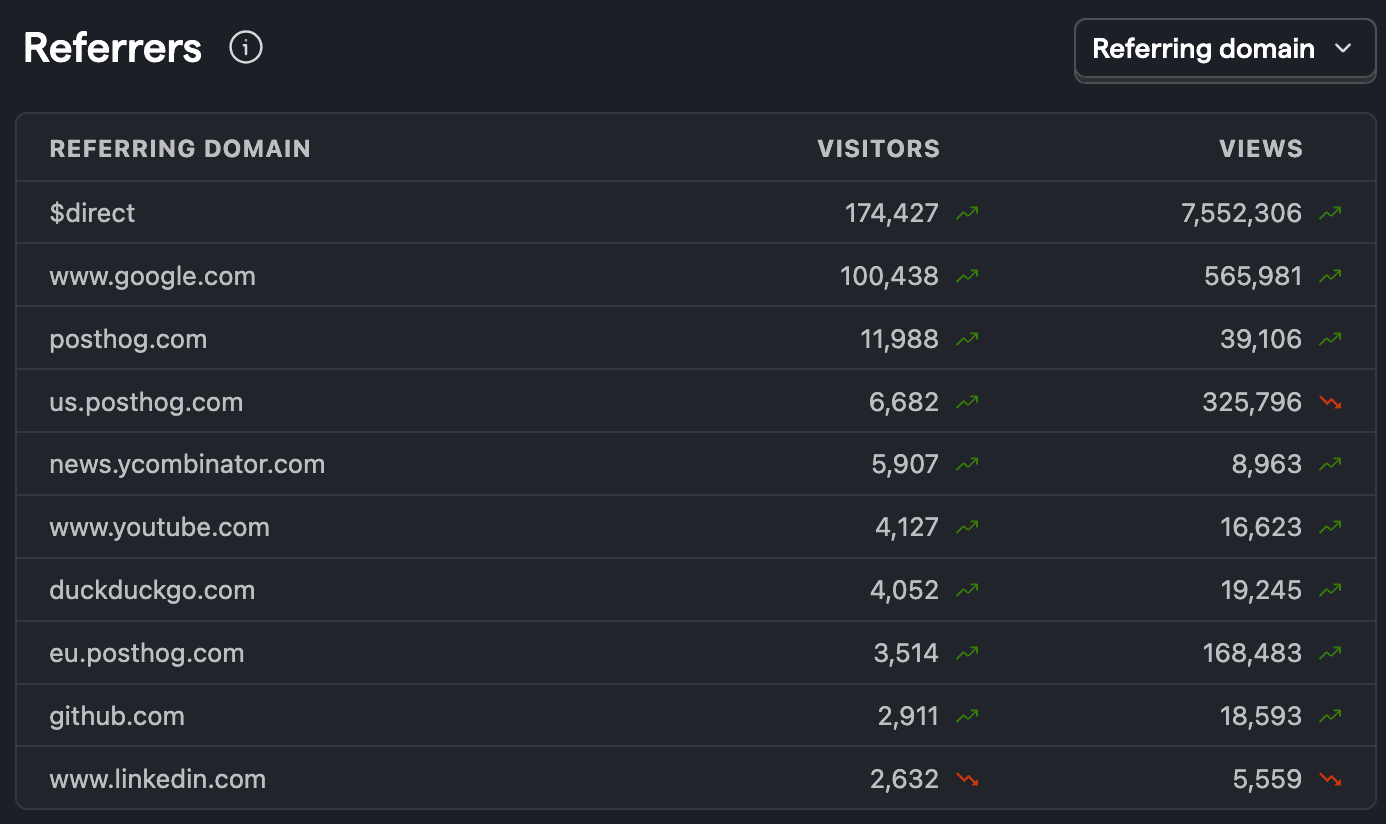
Referrers provides a list of the domains your visitors are coming from. For example, you'll see how many users came from google.com, youtube.com, or ycombinator.com. If a user visits your website directly without coming from somewhere else, it will show up as $direct.
UTM parameters
UTM parameters are another way to get information about where people are coming from. By providing some structured values at the end of our URLs, we can segment visitors into groups.
For example, if you advertise a sale on Google, you can use the URL to indicate the utm_source and utm_campaign:
posthog.com?utm_source=google,utm_campaign=summer-sale
Web analytics enables you to filter by all the various UTM parameters that are available, and you can learn more about them in our UTM segmentation doc. We also have a tutorial on how to track performance marketing that goes into more detail.
Use case: Tracking visitors from a sponsored video
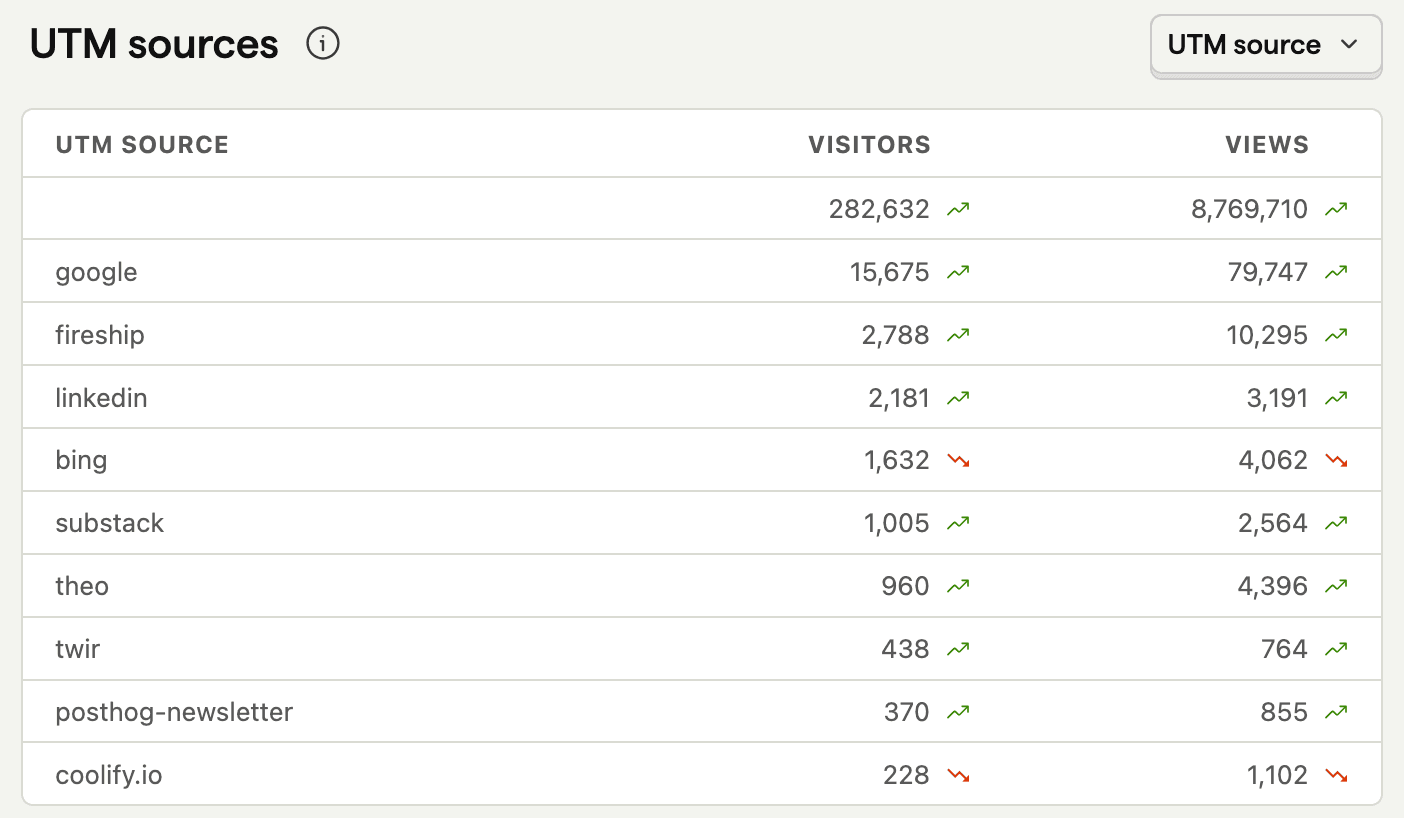
One example of how PostHog uses these features was a recent sponsored video on YouTube. We sponsored a Fireship video, and we can see how it worked below.
For the YouTube video, there's a link in the description for people that are interested in seeing what PostHog is, and it looks like this:
https://posthog.com/fireshipThat URL gets transformed into the following UTM paramaters:
https://posthog.com/?utm_source=fireship&utm_campaign=fireshipThen, we can see how many visitors came from that video by using the "UTM source" option on our web analytics dashboard:
Demographic information
Based on how users are accessing your website, web analytics also provides additional demographic metrics that can help answer the following:
- What kinds of devices are visitors using? Laptops? Tablets? Phones?
- Which browsers and operating systems are most popular?
- Where are users located geographically? Which countries? Which cities?
- What are the most popular languages for visitors?
Goals
The goals section of the web analytics dashboard is all about tracking conversion goals.
A conversion is a key event or action you want users to do. If a user converted, it means they not only visited your website, but also performed some key action like signing up or subscribing.
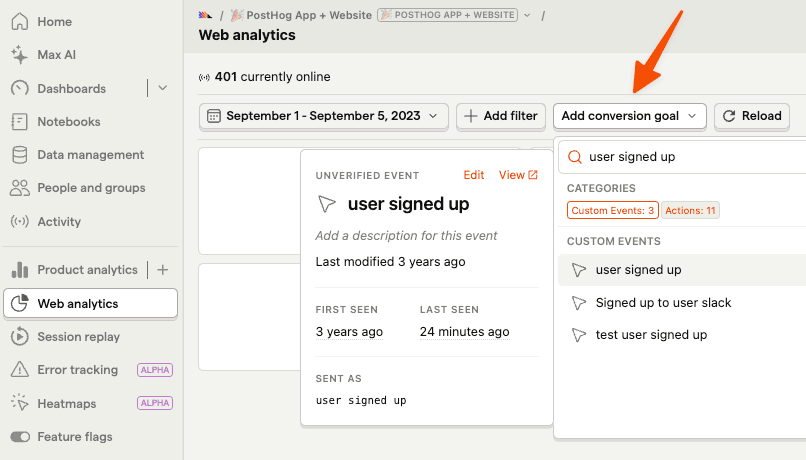
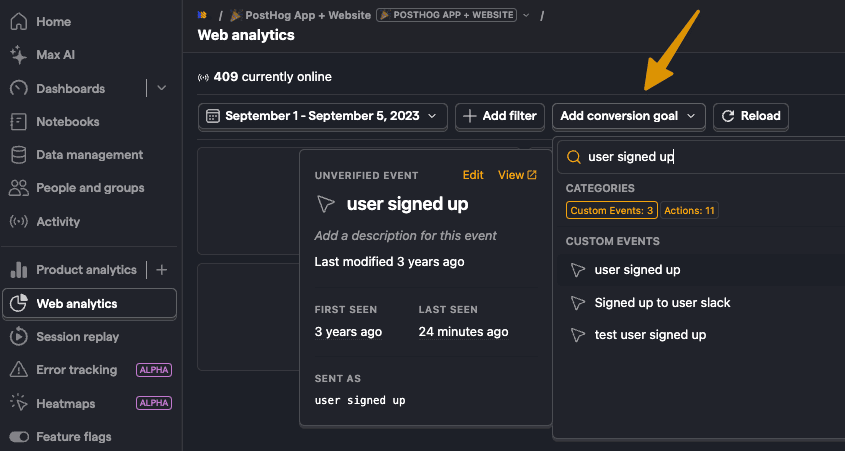
You can click the Add conversion goal button at the top of the web analytics dashboard to create a new goal.
For a more detailed guide, check out the conversion goals doc.
